Adnan A Kadi1,
Ali S Abdelhameed1 ![]() ,
Mohamed W Attwa1,
Mohammad Al-Haddab2,
Rihab F Angawi3
,
Mohamed W Attwa1,
Mohammad Al-Haddab2,
Rihab F Angawi3
For correspondence:- Ali Abdelhameed Email: asaber@ksu.edu.sa Tel:+966114698314
Received: 15 February 2016 Accepted: 6 May 2016 Published: 28 June 2016
Citation: Kadi AA, Abdelhameed AS, Attwa MW, Al-Haddab M, Angawi RF. Liquid chromatographic-mass spectrometric method for determination of drug content uniformity of two commonly used dermatology medications in a split-tablet dosage form. Trop J Pharm Res 2016; 15(6):1283-1292 doi: 10.4314/tjpr.v15i6.22
© 2016 The authors.
This is an Open Access article that uses a funding model which does not charge readers or their institutions for access and distributed under the terms of the Creative Commons Attribution License (http://creativecommons.org/licenses/by/4.0) and the Budapest Open Access Initiative (http://www.budapestopenaccessinitiative.org/read), which permit unrestricted use, distribution, and reproduction in any medium, provided the original work is properly credited..
Purpose: To develop and validate a simple, efficient and reliable Liquid chromatographic-mass spectrometric (LC-MS/MS) method for the quantitative determination of two dermatological drugs, Lamisil® (terbinafine) and Proscar® (finasteride), in split tablet dosage form.
Methods: Thirty tablets each of the 2 studied medications were randomly selected. Tablets were weighed and divided into 3 groups. Ten tablets of each drug were kept intact, another group of 10 tablets were manually split into halves using a tablet cutter and weighed with an analytical balance; a third group were split into quarters and weighed. All intact and split tablets were individually dissolved in a water: methanol mixture (4:1), sonicated, filtered and further diluted with mobile phase. Optimal chromatographic separation and mass spectrometric detection were achieved using an Agilent 1200 HPLC system coupled with an Agilent 6410 triple quadrupole mass spectrometer. Analytes were eluted through an Agilent eclipse plus C8 analytical column (150 mm × 4.6 mm, 5 μm) with a mobile phase composed of solvent A (water) containing 0.1% formic acid and 5mM ammonium formate pH 7.5, and solvent B (acetonitrile mixed with water in a ratio A:B 55:45) at a flow rate of 0.8 mL min-1 with a total run time of 12 min. Mass spectrometric detection was carried out using positive ionization mode with analyte quantitation monitored by multiple reaction monitoring (MRM) mode.
Results: The proposed analytical method proved to be specific, robust and adequately sensitive. The results showed a good linear fit over the concentration range of 20 - 100 ng mL-1 for both analytes, with a correlation coefficient (r2) ≥ 0.999 and 0.998 for finasteride and terbinafine, respectively. Following tablet splitting, the drug content of the split tablets fell outside of the proxy USP specification for at least 14 halves (70 %) and 34 quarters (85 %) of FIN, as well as 16 halves (80 %) and 37 quarters (92.5 %) of TBN. Mean weight loss, after splitting, was 0.58 and 2.22 % for FIN half- and quarter tablets, respectively, and 3.96 and 4.09 % for TBN half- and quarter tablets,respectively.
Conclusion: The proposed LC-MS/MS method has successfully been used to provide precise drug content uniformity of split tablets of FIN and TBN. Unequal distribution of the drug on the split tablets is indicated by the high standard deviation beyond the accepted value. Hence, it is recommended not to split non-scored tablets especially, for those medications with significant toxicity
Introduction
Tablet splitting is a practice used by patients, whereby a tablet of a high dose is split into halves or quarters to provide patients with the minimal dosage prescribed. This practice is becoming common, particularly in psychiatric and geriatric communities as a mean to reduce a drug dose [1,2]. Physicians frequently prescribe half-tablets to give less dose strength than the lowest marketed dose concentration [2-5]. Such practice also helps patients who may find large tablets hard to swallow [1-5]. Additionally, tablet splitting can minimize treatment costs for patients [6]. The FDA has approved splitting scored tablets as an effective and safe practice [3]. The “Uniformity of Dosage Units” section in the U.S. Pharmacopeia (USP) manual states that: “each unit within a single lot of a given medication should have drug substance content that is within a narrow range around the labeled claim” [7]. However, it was frequently reported that the practice of tablet splitting might strongly affect the medications’ therapeutic efficiency [8,9]. To date and despite of the several studies concerned with weight differences among split tablets [2-5,10], the essential investigation of drug content has not been explored yet. Such weight studies used the USP criteria described in “Uniformity of Dosage Units” to verify that actual drug content is similar to the labeled drug content, hence, determination of the drug content in split parts can be achieved indirectly by their weight proportion to the whole tablet [7]. Although, the USP has strict guidance on drug content of the intact tablets, its recommendations on split tablets are not well established.
In the current study, a new highly specific, sensitive, and rapid LC-MS/MS method was developed to determine the content uniformity in whole, halves and quarters tablets of finasteride (FIN; Proscar® 5 mg tablets) and terbinafine (TBN; Lamisil® 250 mg tablets), two commonly used split tablets in dermatology clinics. Thorough review of the literature has revealed that several methods were frequently applied to investigate the tablet content uniformity of various medications including HPLC-UV [10,11], UV spectrophotometry [12] with chemometric analysis [13,14], NIR spectroscopy [15-17] with the aid of chemometrics [18] and HPTLC [19]. Moreover, FIN and TBN quantitative determination in tablet dosage form has been previously reported for each drug either individually or with other drugs using HPTLC [20,21], UV spectrophotometry [22], UPLC [23] and RP-HPLC [24,25] for FIN. In addition, different analytical tools such as capillary electrophoresis [26], HPLC [27], UV derivative spectrophotometry and spectrodensitometry [28] were used for TBN quantification in tablet dosage form. However, the use of mass spectrometry has not been previously reported neither for the assessment of drug content uniformity nor for the determination of FIN and TBN in their tablet dosage forms.
Methods
Chemicals and reagents
Finasteride and terbinafine reference standards (purity; 99.5 %) as well as Lamisil® 250 mg tablets (Novartis Pharma AG, Basel, Switzerland) and Proscar® 5 mg (Merck & Co., Inc. (New Jersey, USA) were provided by King Khaled University Hospital, Riyadh, KSA. Propranolol standard (purity; 99.5 %) was procured from Sigma–Aldrich (St. Louis, MO, USA). HPLC-grade solvents and reagent-grade ammonium formate were acquired from Merck (Darmstadt, Germany). Distilled water was purified and double deionized by an Elix Millipore Milli-Q® UF Plus purification system (Merck Millipore, MA, USA) and was used for the entire study.
Instrumentation and conditions
Chromatographic analysis was conducted using an Agilent 6410 triple quadrupole mass spectrometer (Agilent Technologies, USA) with an electrospray ionization interface (ESI) and coupled to an Agilent 1200 HPLC (Agilent Technologies, USA). Chromatographic separation was performed on an eclipse plus C8 column (150 mm × 4.6 mm, 5 μm) (Agilent Technologies, Palo Alto, CA, USA) kept at a constant temp of 25 ± 2 °C. Optimal conditions for the HPLC system were attained with a flow rate of 0.8 mLmin-1 running for 12 min by a mobile phase composed of two solvents: A is water containing 0.1 % formic acid and 5 mM ammonium formate pH 7.5, and B is acetonitrile mixed in the ratio A:B 55:45. A 5 µl of each sample was injected into the LC-QqQ system.
To achieve the optimal ionization conditions and fragment ion spectra, a mass range of m/z 100–600 was used for the MS scans. The ESI interface was adjusted in positive ion mode with its temperature set to 350 oC and ion spray voltage of 4.5 kV. Furthermore, a flow rate of 12 L/min was set for the desolvation gas (nitrogen), and setting the pressure for the collision gas (high purity nitrogen) at 30 psi. Product ion scans following initial MS2 scans were carried out for each analyte to identify the molecular ion peaks and the fragment ions of FIN, TNB and internal standard (IS). MassHunter software (Agilent Technologies, Palo Alto, CA, USA) was employed to control the instruments and acquire the data. The analytes quantification was performed through their transitions in the multiple reaction monitoring (MRM) viz. FIN transitions of 373.3→317.2 and 373.3→305.2, TBN transitions of 292.2→ 141.1 and 292.2→93.1 and propranolol (IS) 260.2→183 and 260.2→116, all ions had dwell time set at 200 ms. MS parameters for each analyte were brought to their optimum values by altering voltage of the fragmentor inside the ESI when running in scan mode to set values of 115 for FIN and TBN while 145 V for IS. Additionally, by changing the collision energy for the analytes to their optimum values of 16, 14 and 28 eV for FIN, TBN and IS, respectively, for the product ion mode. A Mettler analytical balance (model AG204, Mettler-Toledo, Greifensee, Switzerland), that is accurate to 0.1 mg, was used for all weight measurements.
Sample preparations
Standard stock solutions were prepared by weighing the solid substances of FIN and TBN to 1 mgmL-1 in methanol. Working solutions of finasteride and terbinafine (20, 40, 60, 80 and 100 ngmL-1) were achieved by diluting the stock solution with the mobile phase. An internal standard (IS) working solution of propranolol with a concentration of 560 ngmL-1 was prepared in mobile phase. All solutions were kept at -20 oC for further analysis.
Preparation of solutions from tablets
Thirty intact tablets of both drugs were arbitrarily selected from each drug lot. Tablets were weighed and 10 tablets of each drug were manually split into halves using a tablet cutter and weighed with the analytical balance. Another group of 10 tablets were split into quarters and weighed using the same procedure. The remaining 10 intact tablets of each drug were dissolved separately in water and methanol mixture (4:1) in a 100 mL volumetric flask by manual agitation followed by sonication, and the flasks were then sonicated for 30 min. individual volumes of 2 mL of the tablets solutions was filtered through a Millex-GP, 0.45 µm syringe filter (Millipore, Billerica, MA, USA). Fifty microliters of the filtered solution was subsequently diluted to a volume of 50 mL with the mobile phase. Volumes of 0.5, 1.0 and 2.0 mL of whole, half-, and quarter tablets solutions were then transferred to 25 mL volumetric flasks and filled to mark with mobile phase. Individual portions of 1 ml of the resultant solutions were transferred into HPLC vials, then mixed with 40 µL of IS (14 µgmL-1) and analyzed by the proposed method.
Method validation
The proposed analytical method was validated with regard to its sensitivity, linearity, specificity, accuracy, intra-day and inter-day precision and stability. Validation of the method was executed according to the guidelines recommended by the International Conference on Harmonisation (ICH) [29].
Specificity
Specificity can be defined capability of an analytical method to efficiently quantify the studied analytes without being affected by the other interfering constituents in a sample matrix [30]. To prove the specificity of the current procedure, various placebo tablets samples were analyzed for peaks at the elution time of the analytes and/or IS. The influence of carry-over was diminished by the use of MRM mode and a long elution time after eluting the analytes.
Linearity and sensitivity
Three separate five-point calibration curves (20, 40, 60, 80 and 100 ngmL-1) were drawn by plotting the peak area ratio of FIN or TBN to propranolol (IS) (y-axis) vs. FIN or TBN nominal concentration (x-axis). Analysis of the each calibrated sample was carried out in triplicates. The linear regression equation was used to calculate the slope, intercept, and r2 values, which was then used to compute the concentrations of FIN and TBN in aqueous solutions based on their peak area ratios.
Limit of detection and of quantitation
The limit of quantification (LOQ) defines the lowest standard curve concentration of the analytes that can be determined with reliable precision and accuracy. The limit of detection (LOD) and the limit of quantification (LOQ) were computed as in Eqs 1 and 2, respectively.
LOD = 3.3 𝜎/S …………………… (1)
LOQ = 10 𝜎/S …………………. (2)
Here the intercept standard deviation is represented as 𝜎 while 𝑆 is the slope of the regression line of the calibration plot [29].
Precision and accuracy
Intra-day accuracy and precision measurements were carried out by successive analyses of FIN and TBN samples solutions. Inter-day accuracy and precision were evaluated via the analysis of the calibration standard samples for FIN and TBN on 3 successive days. The ultimate precision of the method was represented as the relative standard deviation while method accuracy (A) was determined as R using Eq 3.
R (%) = (Mc/Pc)100 ………………………. (3)
where R = recovery of the measured concentration, Mc = mean measured concentration and Pc = presumed concentration.
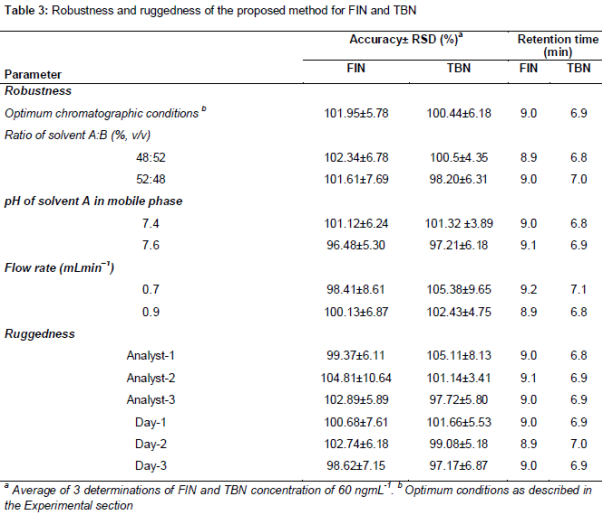
Robustness and ruggedness
To determine the current method robustness, certain essential chromatographic parameters were modified whilst maintaining the other parameters unaltered, while observing and recording the chromatographic profile. Those parameters were slightly varied around their optimum values in the method to simulate the changes that are likely to occur in various test environments. The investigated parameters included the mobile phase composition, flow rate and pH. Similarly, the proposed method ruggedness was investigated with the aid of two different analysts and the use of mobile phase constituents produced by two different manufacturers.
Application of the method
The proposed LC-MS/MS method was used for the determination of Fin and TBN composition in their whole, half- and quarter-tablets to determine their drug content uniformity.
Results
Mass spectrometry and chromatography
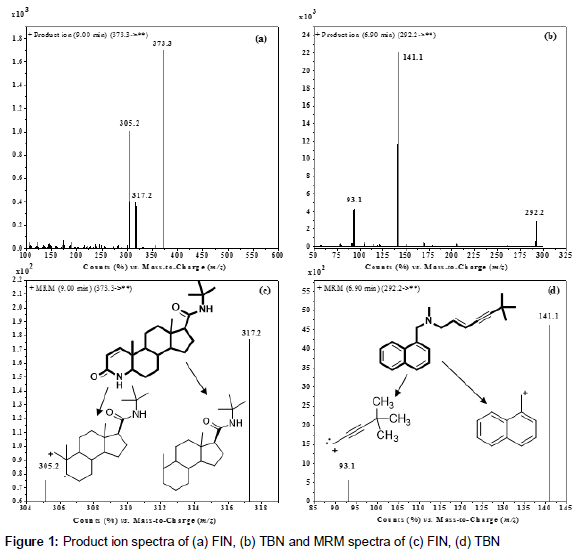
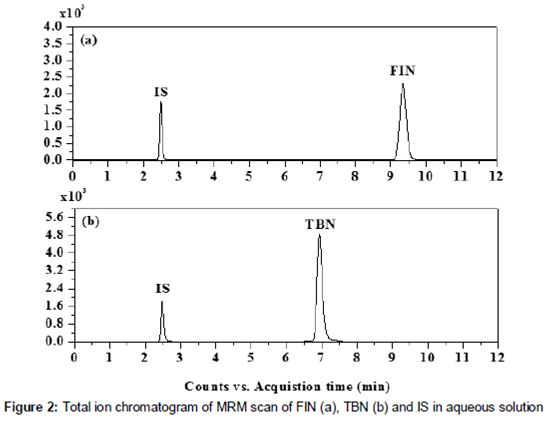
Conditions for the mass spectrometry have been optimized to yield analytes ions with a good stable response. Additionally, interference reduction and sensitivity enhancement was achieved using the multiple reaction monitoring (MRM) mode. The mass spectra of FIN samples showed protonated ions [M+H]+ at m/z 373.3 and two major fragments at m/z 317.2 and 305.2 () that were chosen for the further scanning in the last quadrupole. Similarly, TBN revealed [M+H]+ at m/z 292.2 with two major fragments at m/z 141.1 and 93.1 (). The mass spectrum of the IS, propranolol, showed a [M+H]+ at m/z 260.2, fragmented into two major product ions at m/z 183 and 116. Under the optimal LC conditions, FIN, TBN and IS were eluted at 9.0, 6.9 and 2.5 min, respectively. A blank solution including only internal standard was analyzed occasionally to ensure the absence of carry-over between samples. Examples of the total ion chromatograms of FIN, TBN and IS in MRM mode are represented in .
Validation
The method is comprehensively validated in accordance with the ICH guidelines [29] and is shown to be robust and sufficiently sensitive for routine analysis for FIN and TBN.
Linearity, sensitivity and specificity
Linear regression analysis of the results was performed with the least-square method. The results showed a good linear fit in the concentration range 20-100 ngmL-1 and a good r2 values (correlation coefficient) ≥ 0.999 and 0.998 for FIN and TBN, respectively. The calibration curves have the regression equations of y= 0.0784 x - 0.1962 (r2= 0.9987) for FIN and y= 0.2431 x + 1.8683 (r2= 0.9979) for TBN. The high r2 values inferred the good linearity, likewise, the intercept and the slope low standard deviations referred to the appropriateness of the calibration points used for establishing the calibration plot.
Limit of detection and of quantification
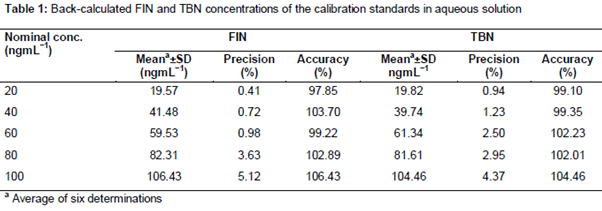
The limit of quantification (LOQ) values were 13.83 and 17.58 ngmL−1 for FIN and TBN, respectively. Values of the limit of detection (LOD) were calculated to be 4.56 and 5.80 ngmL−1 for FIN and TBN, respectively. demonstrates accuracy and precision of calibration graphs through back-calculated FIN and TBN calibration standards concentrations. The accuracy of the analytes back calculated concentrations in the range of 20-100 ngmL−1 varied from 97.85 to 106.43 % for FIN with a degree of precision range of 0.41 to 5.12 %, and 99.10 to 104.46 %, for TBN with a precision range of 0.94 to 104.46 %.
Precision and accuracy
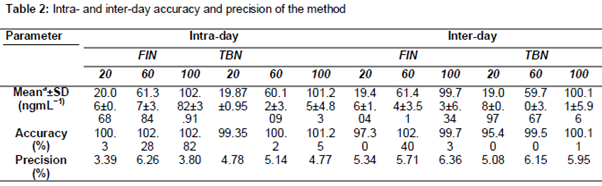
The precision and accuracy at three varying concentrations of 20, 60 and 100 ngmL-1 for FIN and TBN were within the acceptable limits (). Intra- and inter-day relative standard deviations (precision, % RSD) were in the range of 3.39-6.36 % and 4.77-6.15 % for FIN and TBN, respectively. Accuracy was estimated to be in the range of 97.30-102.82 % and 95.40-101.25 % for FIN and TBN, respectively ().
Robustness and ruggedness
Evaluating the robustness, it was clear that minor alteration in one parameter had no significant effect on the results, for example, values of the recovery were found to be in the range of 96.48–102.34 % for FIN and 97.21–105.38 % for TBN (). This demonstrated the reliability of the developed method for the routine quantitative determination of FIN and TBN. Ruggedness of the proposed method was evaluated with the relative standard deviation ().
Tablet weight and drug content uniformity
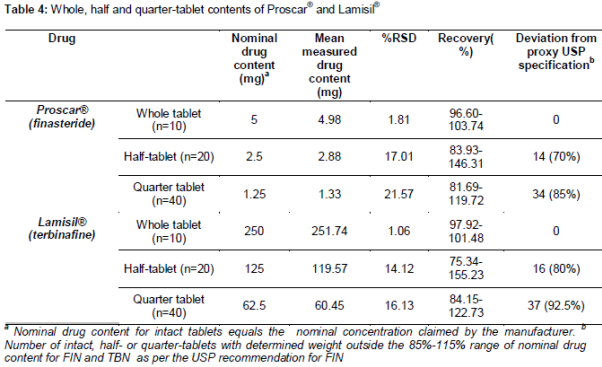
The proposed LC-MS/MS method was successfully used to provide a more precise drug content uniformity in split tablets of FIN and TBN. The determined weight and drug contents were examined against USP specified percentage range of FIN and TBN to confirm if the dosage form fall outside or inside this range. A range of 85 – 115 % was used for both FIN and TBN tablets contents [31].
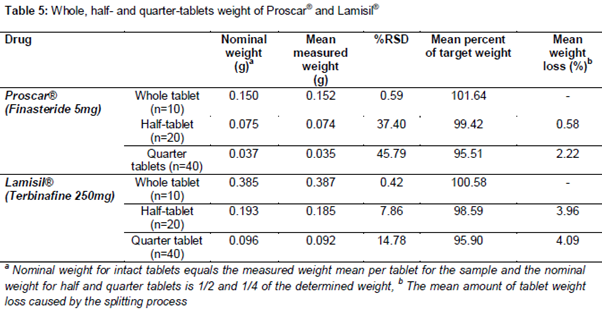
The determined drug content (as a percent of target drug content) and the %RSD were found to fall within the proxy USP specification percentage range for all the studied intact tablets of both FIN and TBN (). However, following their splitting this percent was found to fall outside of the proxy USP specification in case of half- and quarter tablets for at least 14 (70 %) and 34 (85 %) for FIN, respectively as well as 16 (80 %) and 37 (92.5 %) for TBN half- and quarter tablets, respectively. Moreover, the measured weight -expressed as a percent of target weight was computed for all the studied tablets ().
The mean percent weight loss, after splitting, was calculated to be 0.58 and 2.22 % for FIN half- and quarter tablets, respectively and 3.96 and 4.09 % for TBN half- and quarter tablets, respectively.
Discussion
Based on the widespread practice of tablet splitting and the therapeutic consequences of this approach, this study was devoted to develop a reliable and specific LC-MS/MS method for the quantification of two of the commonly prescribed medication in their split tablets. Finasteride (FIN) and terbinafine (TBN) are two medications used to be split in dermatology clinics, hence they were selected as model dosage forms for such study. LC-MS/MS method development was achieved using a mobile phase composed of acetonitrile mixed with water (containing 0.1 % formic acid and 5 mM ammonium formate pH 7.5) in a ratio of 55:45 running through an eclipse plus C8 column (150 mm × 4.6 mm, 5 μm) (Agilent Technologies, Palo Alto, CA, USA) at a flow rate of 0.8 mLmin-1. Ion monitoring and quantification was accomplished using the multiple reaction monitoring (MRM) mode.
Mass spectra of FIN samples showed protonated ions [M+H]+ at m/z 373.3 and two major fragments at m/z 317.2 and 305.2 while, TBN showed [M+H]+ at m/z 292.2 with two major fragments at m/z 141.1 and 93.1 (). Following their chromatographic separation, FIN, TBN and IS were eluted at 9.0, 6.9 and 2.5 min, respectively. The proposed method was validated according to the ICH guidelines [29]. The current method appeared to be specific as no interference was noted neither in blank solutions nor in placebo tablets solutions at the retention times of FIN and TBN. Moreover, possible carry-over effects were reduced by using MRM mode and a longer run time after analytes elution, hence, carry-over effect was absent in the LC-QqQ system. Moreover, the data acquired from the ruggedness and robustness studies as well as the intra- and inter-day accuracy and precision reflected the reproducibility of the analytical data obtained by the proposed method. The method was applied for the estimation of the drug content in split tablets of FIN and TBN. Although lower percentage of weight loss was achieved as shown in , but when determining the drug content, high percentage of split tablets deviated from the specified 85-115 % () due to the unequal distribution of the drugs in their split tablets. The latter observation supports the principle of using the actual drug content estimated by analytical means in investigating drug content uniformity of split tablets rather than using the drug weight as guidance for the amount of drug in their split tablets. Ultimately, this study would also stress that the approach of tablet splitting should be practiced with caution especially with medications that have toxic adverse effects.
Conclusion
An optimized LC-MS/MS method has validated for the quantification of FIN and TBN content in their split tablets with good linearity in the range of 20-100 ngmL-1. The developed LC-MS/MS method is rapid, robust, highly selective, and sufficiently sensitive. The data obtained for tablet weight and drug content uniformity of FIN and TBN split tablets show that the practice of splitting non-scored tablets is not a suitable approach to prescribe lower drug doses, as it is not advisable for patients using other medications with greater toxicity to practice it.
Declarations
Acknowledgement
References
Archives


News Updates